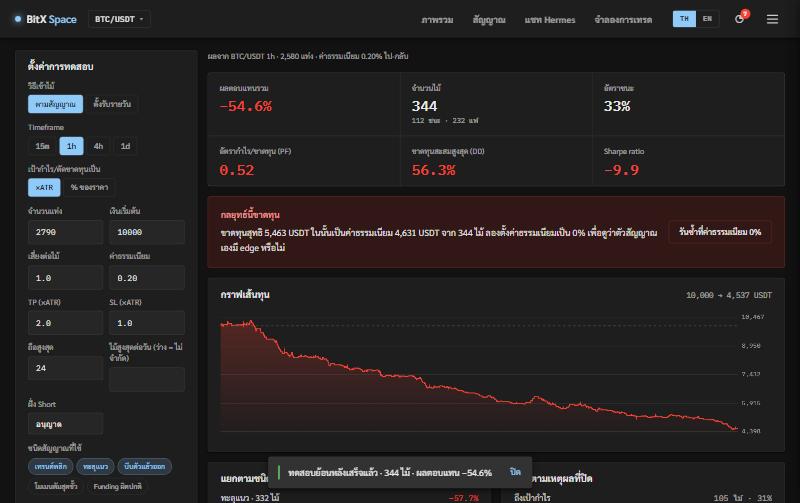
An equity curve climbing beautifully is what everyone wants to see — and that is exactly why it’s dangerous. Results that look too good usually come from the testing method, not the strategy.
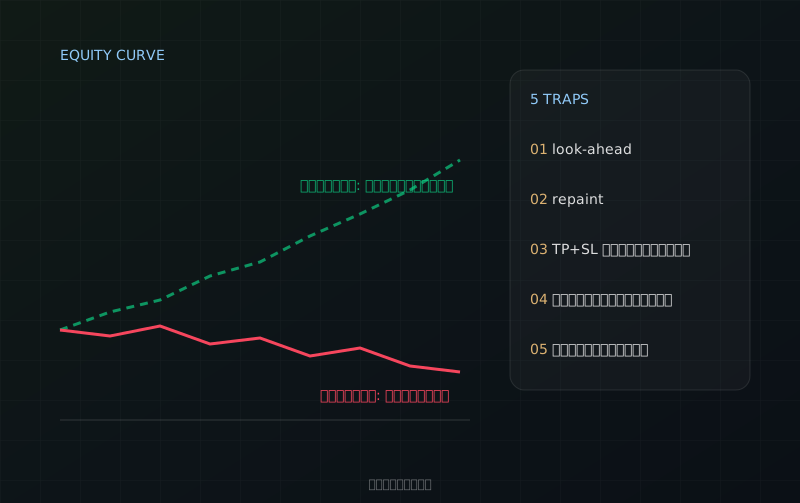
1. Peeking at the future (look-ahead bias)
Using data that didn’t exist yet at the time, such as the close of a candle that hadn’t closed. A good test lets each candle see only data up to that candle.
2. Signals that change after the fact (repaint)
Signals that appear while a candle is still running and vanish when it closes look very accurate in a backtest but can’t be used live. The fix is to compute from closed candles only.
3. Optimism when filling orders
If one candle touches both the target and the stop, you can’t know which came first. Counting it as a win is fooling yourself; count it as a loss.
4. Forgetting fees and slippage
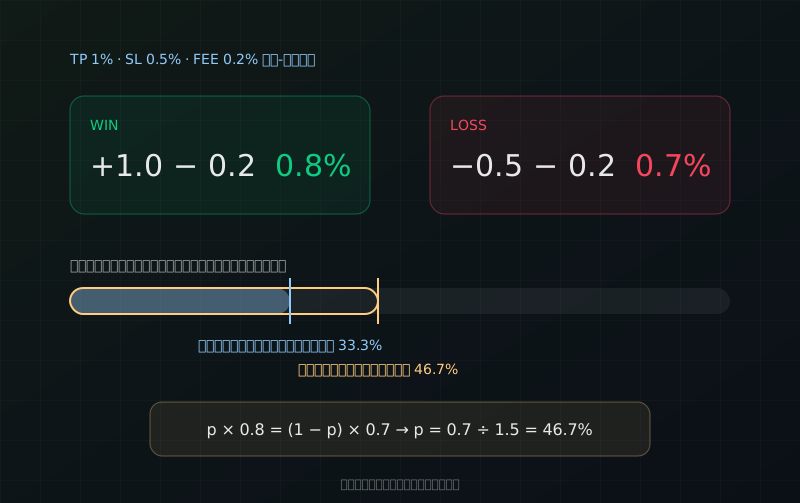
A frequent-trading strategy can be profitable before fees and losing after them. A test that doesn’t deduct fees means almost nothing.
5. Too few samples
Winning 8 of 10 trades may just be luck. The smaller the sample, the wider the uncertainty — always read the number of trades alongside the win rate.
How BitX Space guards against them
- Computes from closed candles only, and each candle sees only data up to itself
- A candle that touches both target and stop counts as a loss
- Deducts 0.2% round-trip fees by default
- Lessons the system draws need at least 20 samples, with a statistical confidence interval