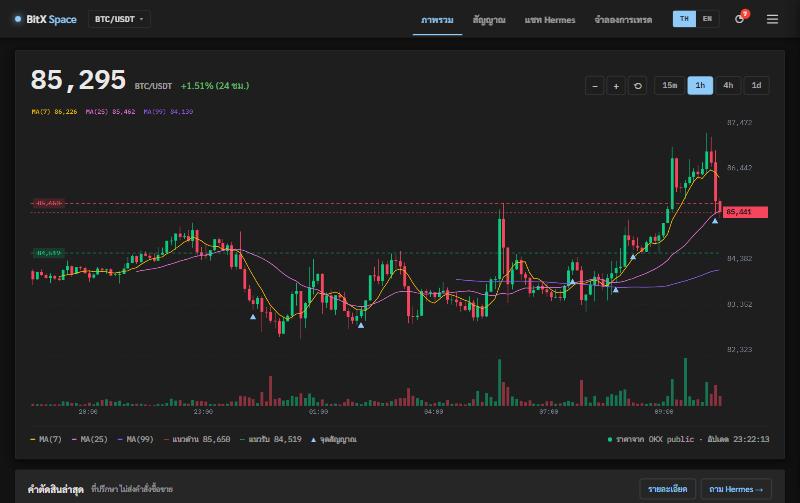
Ever seen a clear buy signal on a short chart, then watched the price keep falling? Most of the time the signal wasn’t wrong — the problem was looking at only one timeframe.
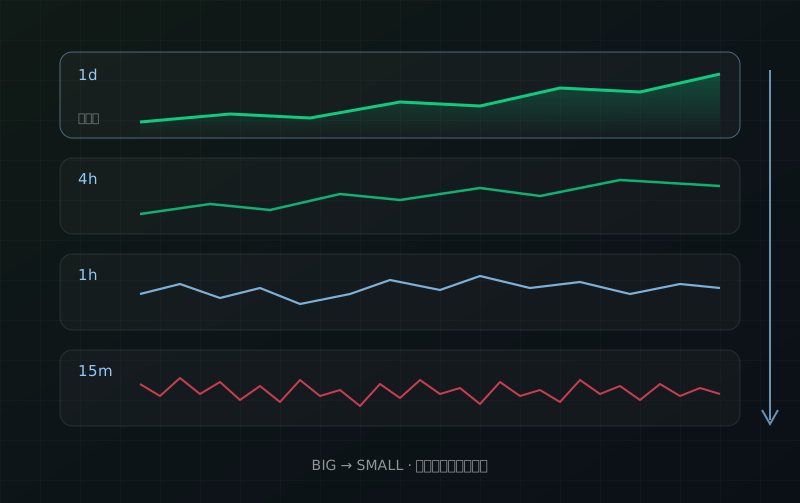
Each timeframe answers a different question
- Daily (1d) — the big picture: uptrend, downtrend or sideways
- 4 hours (4h) — the medium structure: which way the big wave is going
- 1 hour (1h) — the rhythm: resting or accelerating
- 15 minutes (15m) — the detail: sharper entries, but more false signals
Rules that work
Go from big to small. Always look at the daily first. If the daily is in a downtrend, a buy signal on 15 minutes goes against the current — be extra careful.
Look for moments when every timeframe agrees. The more timeframes point the same way, the better the odds the move continues.
When they disagree, wait. Not trading can be a good decision, especially when the big and small pictures don’t match.
How BitX Space helps
The system computes the trend on all 4 timeframes and combines them into a “confluence score” from −1 to +1. Near +1, the timeframes agree it’s up; near −1, they agree it’s down; near 0, the picture isn’t clear yet — see it on the home page under “The market now”.